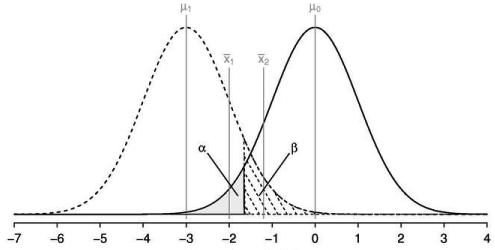
Alpha Risk
Alpha risk is the risk of incorrectly deciding to reject the null hypothesis.If the confidence interval is 95%, then the alpha risk is 5% or 0.05.
For example, there is a 5% chance that a part has been determined defective when it actually is not. One has observed or made a decision that a difference exists but there really is none.
Alpha error is also called False Positive and Type I Error.
Confidence Level = 1 - Alpha
Throughout this site, an Alpha risk of 0.05 is assumed, making the confidence level = 95%.
Alpha is called the signficance level of a test. The level of significance is commonly between 1% or 10% but can be any value depending on your desired level of confidence or need to reduce Type I error. Selecting 5% signifies that there is a 5% chance that the observed variation is not actually the truth.
In summary, it's the amount of risk you are willing to accept of making a Type I error.
Beta Risk
Beta risk is the risk that the decision will be made that the part is not defective when it really is. In other words, when the decision is made that a difference does not exist when there actually is.If the power desired is 90%, then the Beta risk is 10%.
There is a 10% chance that the decision will be made that the part is not defective when in reality it is defective. Or when the decision is made that a difference does not exist when there actually is.
The Power of a test = 1 - Beta
Beta error is also called False Negative and Type II Error.
The Power is the probability of correctly rejecting the Null Hypothesis.
The Null Hypothesis is technically never proven true. It is "failed to reject" or "rejected".
"Failed to reject" does not mean accept the null hypothesis since it is established only to be proven false by testing the sample of data.
Decision Matrix
Hypothesis Testing Steps
1) Define the Problem2) State the Objectives
3) Establish the Hypothesis
4) State the Null Hypothesis (Ho)
5) State the Alternative Hypothesis (Ha)
6) Select the appropriate statistical test
7) State the Alpha Risk level
8) State the Beta Risk level
9) Establish the Effect Size
10) Create Sampling Plan, determine sample size
Now, the physical part of the test:
11) Gather samples
12) Collect and record data
13) Calculate the test statistic
14) Determine the p-value
If p-Value is < than alpha-risk, reject Ho and accept Ha
If p-Value is > than alpha-risk, don’t reject the Null, Ho
Try to re-run the test (if practical) to further confirm results. The next step is to take the statistical results and translate it to a practical solution.
It is also possible to determine the critical value of the test and use to calculated test statistic to determine the results. Either way, using the p-value approach or critical value provides the same result.


No comments:
Post a Comment