Sunday, 5 August 2012

Hypothesis Test

Hypothesis Testing

Selecting the appropriate comparison test for a project can be challenging for GB/BB's, especially in the learning stages. It is always best to confirm this with a BB/MBB.
There are many more than listed here and a Black Belt should advance their study in these tests and non-parametric tests. One popular source is Juran's Quality Handbook (1999).
It is also important to understand the manual computation of these as many of these tests (some can be very mathematically challenging). Many statistical software programs have simplified the work to the point where comprehension and fluency in these tests is convenient to overlook.
Parametric Tests are used when:
  • Normally distributed data
  • Non-normal distribution but transformable
  • Sample size is large enough to satisfy the Central Limit Theorem
  • Require that the data be interval or ratio data.
    Nonparametric Tests are used when:

  • The above critiria are not met or if the distribution is unknown:
  • These test are used when analyzing nominal or ordinal data.
  • Nonparametric test can also analyze interval or ratio data.


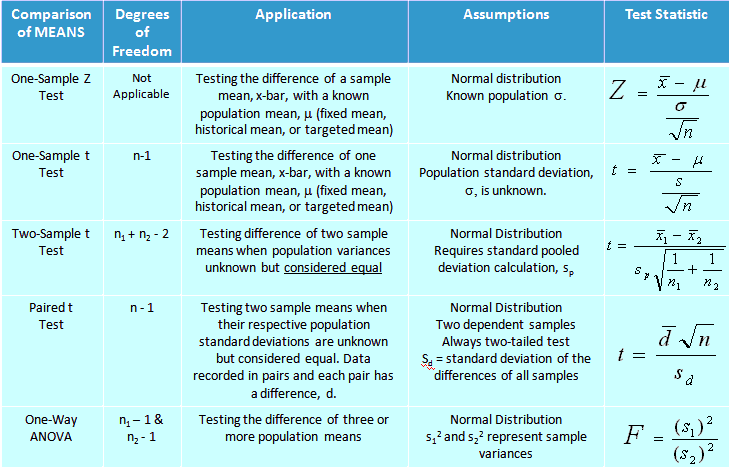
    Table of Comparison of Means using parametric tests

    Comparison of Sample Means


    Hypothesis Testing Steps

    1) Define the Problem
    2) State the Objectives
    3) Establish the Hypothesis
    4) State the Null Hypothesis (Ho)
    5) State the Alternative Hypothesis (Ha)
    6) Select the appropriate statistical test
    7) State the Alpha Risk level
    8) State the Beta Risk level
    9) Establish the Effect Size
    10) Create Sampling Plan, determine sample size

    Now, the physical part of the test:

    11) Gather samples
    12) Collect and record data
    13) Calculate the test statistic
    14) Determine the p-value

    If p-Value is < than alpha-risk, reject Ho and accept Ha
    If p-Value is > than alpha-risk, fail to reject the Null, Ho

    Try to re-run the test (if practical) to further confirm results. The next step is to take the statistical results and translate it to a practical solution.

    It is also possible to determine the critical value of the test and use to calculated test statistic to determine the results. Either way, using the p-value approach or critical value should provide the same result.


    Create a Visual Aid of the Test

    To make the learning process easier, it is recommended that the problem be broken into four smaller steps.
    Create a table similar to the one below and begin by completing the top two boxes. The bottom-left is the results from the test and then then coverting those numbers into meaning is the practical result that belongs in the bottom-right box.
    Hypothesis Test Chart


    The null hypothesis is refered to as "Ho".

    The alternate hypothesis is referred to as "Ha".

    This is the hypothesis being tested or the claim being tested. The null hypothesis is either "rejected" or "failed to reject". Rejecting the null hypothesis means accepting the alternative hypothesis.
    The null hypothesis is valid until it is proven wrong. This is done by collecting data and using statistics with a specified amount of certainty. The more samples of data usually equates as more evidence and reduces the risk of an improper decision.
    The null hypothesis is never accepted, it can be "failed to reject" due to lack of evidence, just as a defendant is not proven guilty due to lack of evidence. The defendant is not necessarily innocent but is determined "not guilty".
    There is simply not enough evidence and the decision is made that no change exists so the defendant started the trial as not guilty and leaves the trial not guilty.


    Selecting the Hypothesis Test

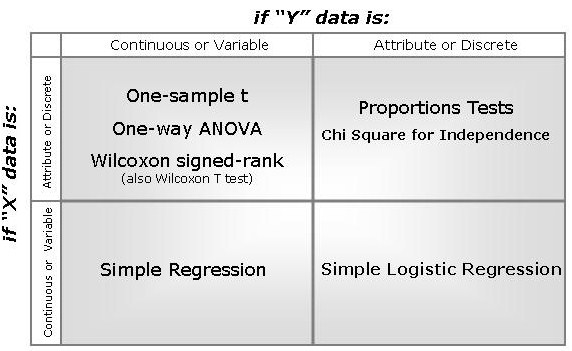
    If you have One X and One Y variable and......

    Hypothesis Test Matrix 1 Y and 1 X

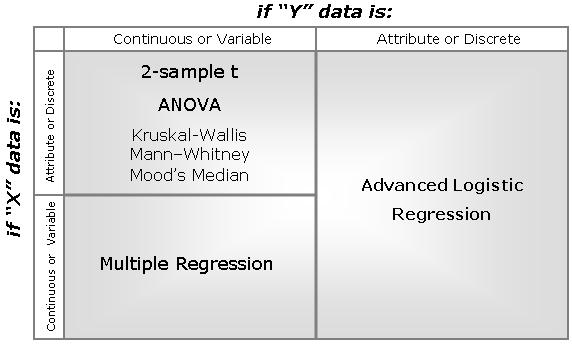
    If you have >1 X and One Y variable and......

    Hypothesis Testing Visual Aid >1X1Y
  • Six Sigma-Alpha and Beta Risk

    Alpha Risk

    Alpha risk is the risk of incorrectly deciding to reject the null hypothesis.
    If the confidence interval is 95%, then the alpha risk is 5% or 0.05.
    For example, there is a 5% chance that a part has been determined defective when it actually is not. One has observed or made a decision that a difference exists but there really is none.
    Alpha error is also called False Positive and Type I Error.
    Confidence Level = 1 - Alpha
    Throughout this site, an Alpha risk of 0.05 is assumed, making the confidence level = 95%.
    Alpha is called the signficance level of a test. The level of significance is commonly between 1% or 10% but can be any value depending on your desired level of confidence or need to reduce Type I error. Selecting 5% signifies that there is a 5% chance that the observed variation is not actually the truth.
    In summary, it's the amount of risk you are willing to accept of making a Type I error.


    Beta Risk

    Beta risk is the risk that the decision will be made that the part is not defective when it really is. In other words, when the decision is made that a difference does not exist when there actually is.
    If the power desired is 90%, then the Beta risk is 10%.
    There is a 10% chance that the decision will be made that the part is not defective when in reality it is defective. Or when the decision is made that a difference does not exist when there actually is.
    The Power of a test = 1 - Beta
    Beta error is also called False Negative and Type II Error.
    The Power is the probability of correctly rejecting the Null Hypothesis.
    The Null Hypothesis is technically never proven true. It is "failed to reject" or "rejected".
    "Failed to reject" does not mean accept the null hypothesis since it is established only to be proven false by testing the sample of data.

    Decision Matrix

    Alpha and Beta Risk

    Hypothesis Testing Steps

    1) Define the Problem
    2) State the Objectives
    3) Establish the Hypothesis
    4) State the Null Hypothesis (Ho)
    5) State the Alternative Hypothesis (Ha)
    6) Select the appropriate statistical test
    7) State the Alpha Risk level
    8) State the Beta Risk level
    9) Establish the Effect Size
    10) Create Sampling Plan, determine sample size

    Now, the physical part of the test:

    11) Gather samples
    12) Collect and record data
    13) Calculate the test statistic
    14) Determine the p-value

    If p-Value is < than alpha-risk, reject Ho and accept Ha
    If p-Value is > than alpha-risk, don’t reject the Null, Ho

    Try to re-run the test (if practical) to further confirm results. The next step is to take the statistical results and translate it to a practical solution.

    It is also possible to determine the critical value of the test and use to calculated test statistic to determine the results. Either way, using the p-value approach or critical value provides the same result.

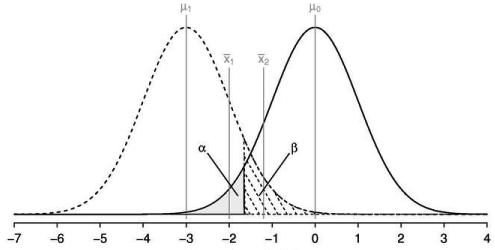
    Visual Relationship of Alpha & Beta Risk

    Alpha and Beta Risks